#8. Gold Bullion, Setting Up to Test the Upside in 2023
#8. Gold Bullion, Setting Up to Test the Upside in 2023
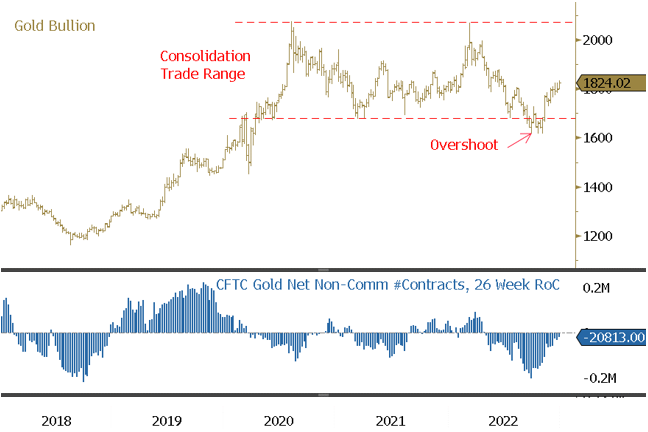
From the March 2022 highs, short-term gold prices were mainly dictated by investment trading flows dominated by CTA types. Figure 5a in the lower panel shows the CFTC Net Non-Comm gold positioning change on a rolling six-month rate of change to highlight the trading intensity. In our November commentary, we highlighted several factors that indicated that gold had reached a cyclical low.
As global oil contracts increasingly use the yuan, gold may return as a settlement medium via RMB-gold convertibility in China's new rival economic and monetary system. The need to build sufficient gold for this facilitation is another possible reason for the massive surge in gold imports from China in 2022 and the early days of 2023. As the de-dollarization process takes hold, gold will likely become much more attractive than the U.S. dollar for any country aligned in this new China-led economic sphere due to RMB-gold convertibility and avoiding sanctions risks from the West. De-globalization requires a competing financial banking system, and gold appears to be the primary "outside money" capable of seamlessly crossing between the systems. Also, this development would likely significantly reduce gold lending banks' desirability to facilitate shorting gold as the risk of liquidity mismatch would be so significant once gold re-enters settlement markets ("paper gold" becomes an unstable borrow).
The emergence of a "petroyuan" and concurrent de-dollarization, combined with RMB-gold convertibility, may lead to an increased correlation between gold, oil and the RMB/yuan over time. Although perhaps early on, the change in macro drivers for gold would be essential to understand changes in gold pricing dynamics.
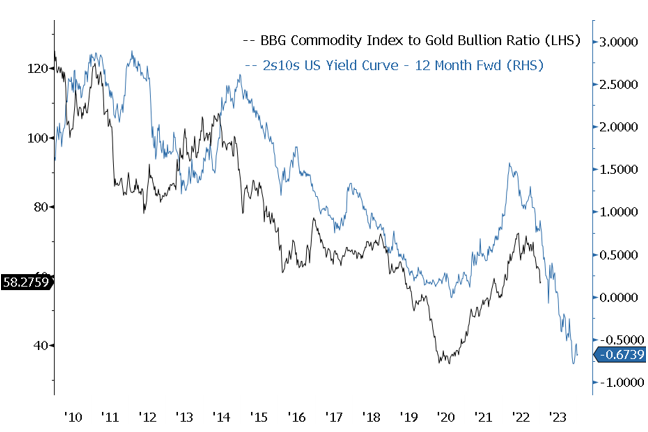
Near term, we highlight Figure 5b for consideration from a broad commodity versus gold bullion point of view (or sensitive economic asset versus safe haven asset). The blue line is the 2s10s yield curve forwarded 12 months, providing an excellent lead indicator for the Bloomberg Commodity Index versus gold bullion ratio. The U.S. Treasury 2YR/10YR yield curve is steeply inverted, warning of a possible recession. After underperforming the broad commodities for a few years, we would expect gold to outperform in 2023. The harder the landing, the more significant the relative gold outperformance.
Figure 5a. Gold Bullion: Oversold and Overshot Positioning Reversing (2018-2022)

Figure 5b. Bloomberg Commodity/Gold Ratio and the Treasuries 2YR/10YR Yield Curve (2010-2022)

Source: Bloomberg. Data as of 12/31/2022. Included for illustrative purposes only. Past performance is no guarantee of future results.
Gold is a massive inflation hedge.

Comments
Post a Comment